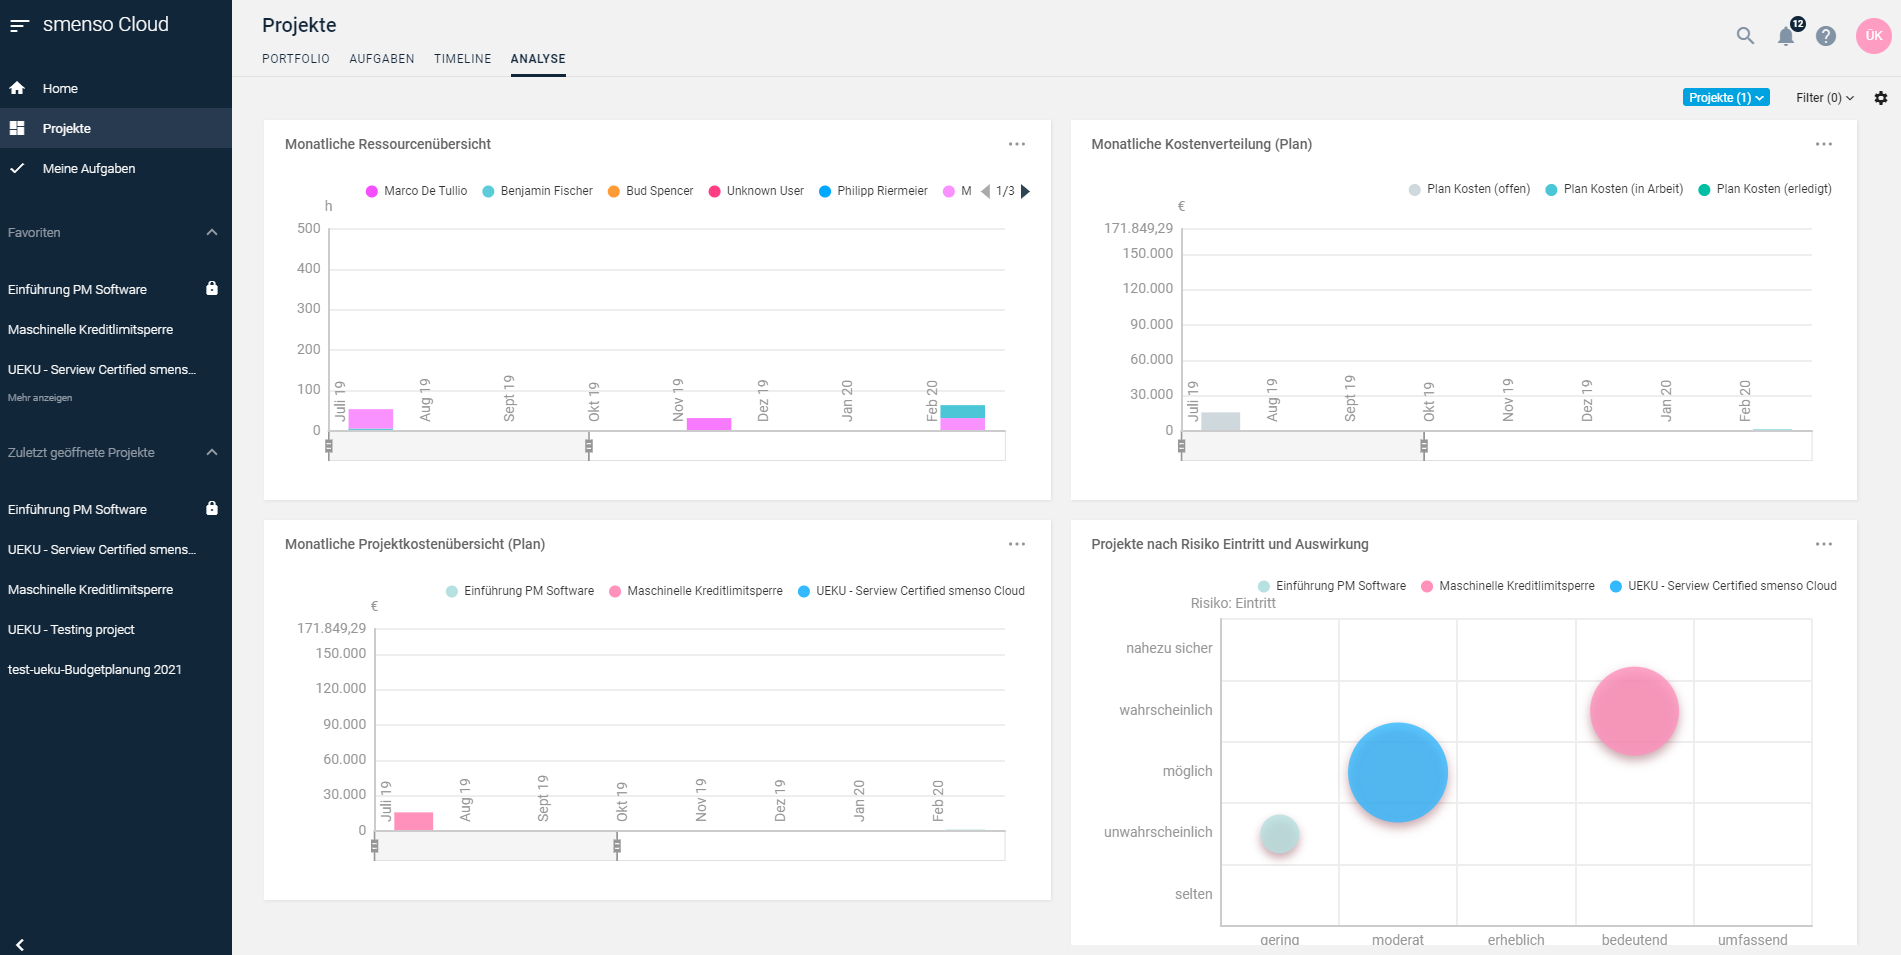
Go to Projects > Analysis to find several widgets for portfolio analysis.
Different widgets are available and can be shown or hidden by clicking on the ⚙ icon. Please note that the Bubble Chart widget is configurable (see below).
By using the two filters Projects and Filters you can select the projects you would like to analyze.

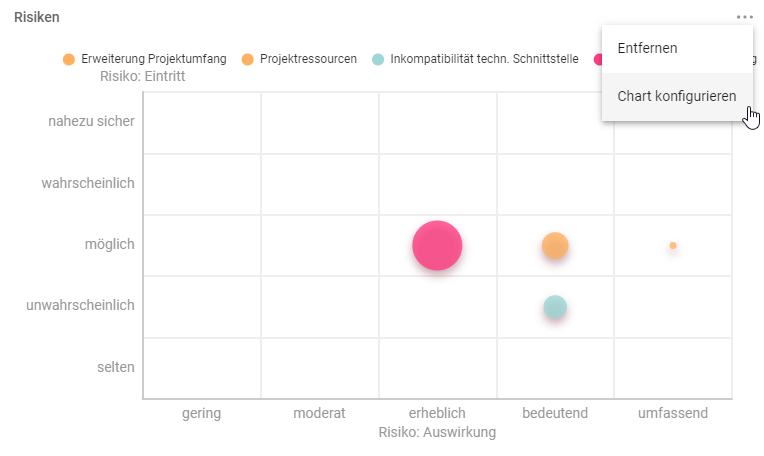
Configuring the bubble chart
A Bubble Chart widget is available as a configurable chart. You can rename this widget and define the fields for the axes and the calculation base for the bubble size. Flavors can also be selected.


Comments
0 comments
Please sign in to leave a comment.